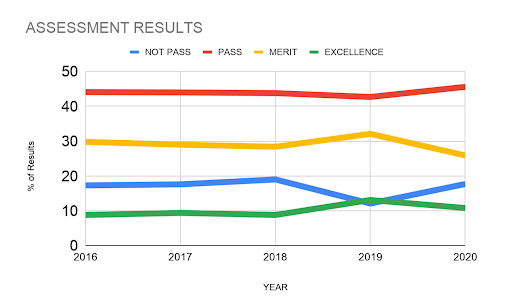
I recently worked with a school that had asked me to help out with professional development. Before I arrived at the school, I asked my contact to provide me with a list of various improvements to courses and teaching that staff reported making over the last few years. I also requested a graph showing the percentage of each assessment mark achieved by Grade 10 students for the last 5 years. My contact wasn’t aware of such a graph being on file or part of any existing report, so this had to be generated especially. In New Zealand, overall results are made public anyway, so this wouldn’t be seen as an issue.
Improvements?
The staff reported improvements to their Grade 10 programs in several ways, such as:
- Redesigning the course
- Redesigning the resources
- Simplifying the Assessment
- Doing multiple things to better accommodate boys
- Introducing an interactive learning platform as an additional support
- Removing said interactive learning platform
- New textbooks
- Doing mini-tests more frequently
- Redesigning the grading rubric to make it more readable
- Making the resource more student-friendly


