OESIS 2022 Head of School Survey Report, Part 1 of 3: Governance | Sanje Ratnavale | 9 Min Read

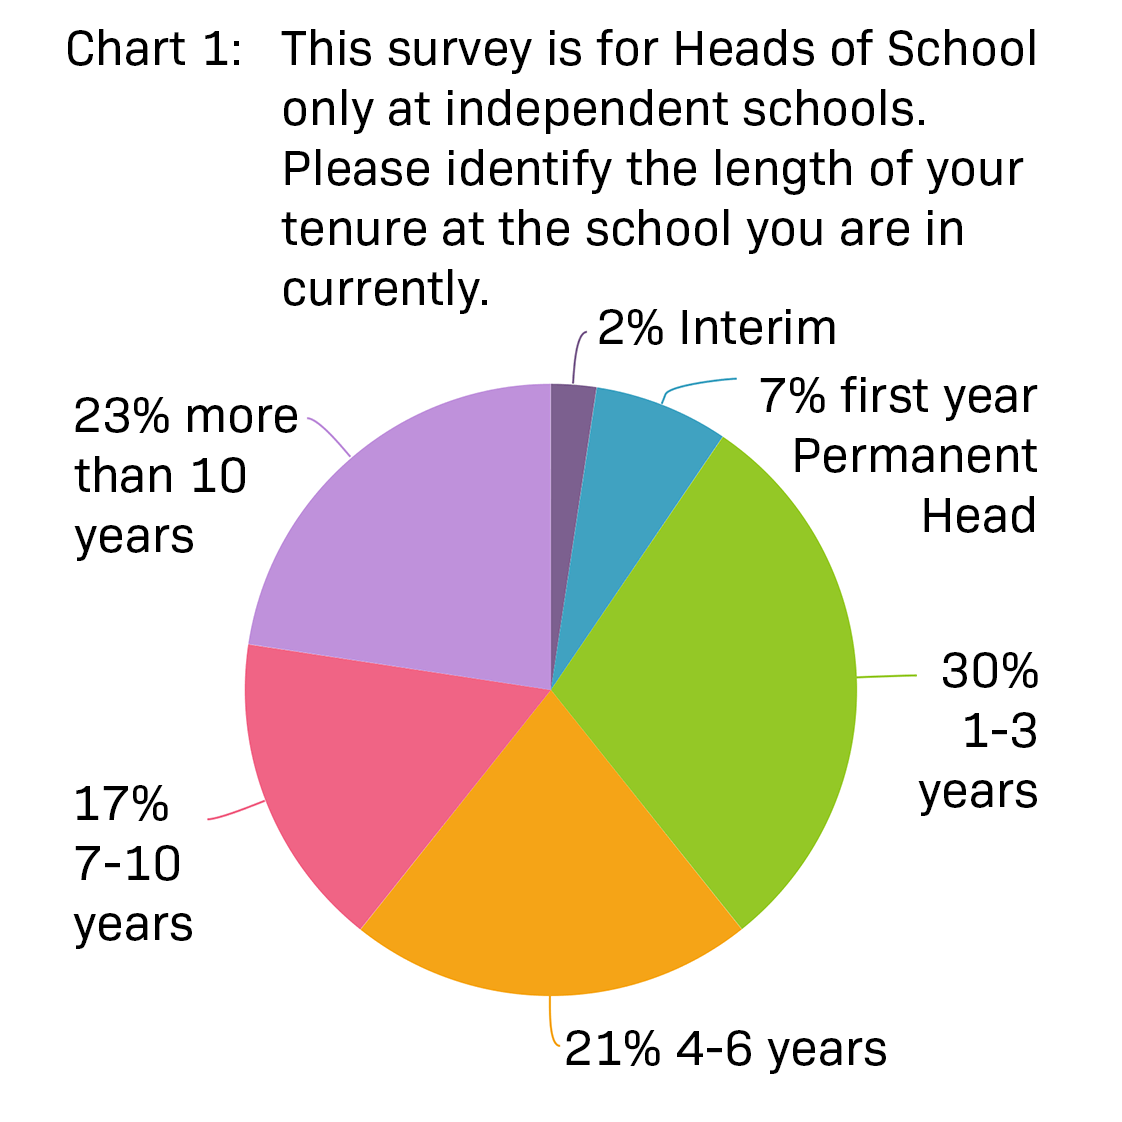
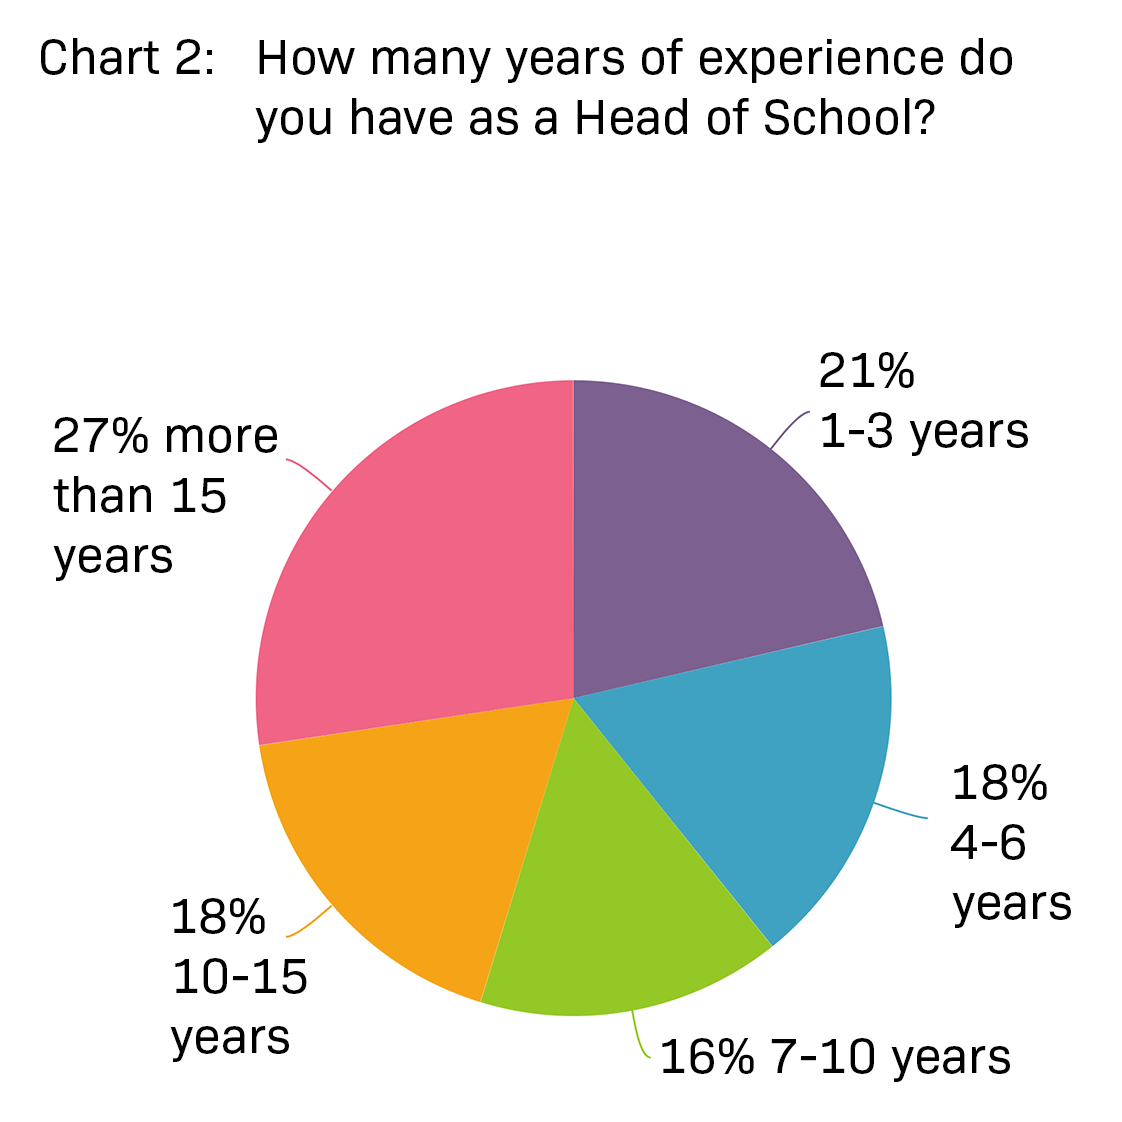
This is the second time in less than 12 months that we have surveyed Heads of School in our network: in July of last year we had 75 Heads responding and in March we had 84 Heads of School completing the survey (See charts below). 

At OESIS, we have come to a view on independent school governance and have used the surveys to collect evidence to validate or invalidate these views. They are concerned with the differences between “Inputs”, “Outputs” and “Outcomes”. Independent schools are measured almost exclusively by “Inputs” like enrollment or “Outputs” like strategic plans, and as we argued in the series of articles on NAIS Governance and Strategic Planning, schools have evolved into a condition of serious misalignment. 

This Survey Report is divided into 3 sections: Governance, Teachers, and DEI. In this section (Part 1), we look at Governance more deeply from an “Outcome” perspective based on the survey data generated. So ask yourself this question before we get to the data: what outcomes would you consider to be indicators of good governance practices and systems

Let’s take a governance example using the DEI initiatives at school: hiring more faculty of color would be an example of an input, having a faculty diversity committee or affinity group might be an output, but an outcome might be evidence of the impact that having more faculty of color improved inclusion and achievement for BIPOC students or simply improved the quality of the teaching. All measurable impacts.

Mea culpa. Let me make this analysis a little more informal with a story of my own realization that I did not see the differences. On my first time leading a CAIS CA  accreditation more than 15 years ago for a school we had founded in Los Angeles, I was sent to Camarillo, CA for WASC training for accreditation leaders. The lady in charge began by asking all of us to open our ESLRs. I looked around and saw lots of shuffling and pretended to do the same. But what were ESLRs? The workshop continued until I realized this was untenable and I had to risk looking stupid and asked “Excuse me, can you clarify what you mean by ESLRs?”. She looked astonished and responded “ What is your role at your school?” I responded “Associate Head of School, High School Principal, and CFO.” What kind of school?” she persisted.  “K-12, around 750 students,” I continued, as I saw that look of frowning disapproval spreading over her face. “You don’t have ESLRs, are you a private school? ESLRs are Expected School-Wide Learning Results. I think you are in the wrong session. This is WASC accreditation training for public schools.” I left in shame, wondering what were our school-wide results or outcomes. All I could think of were minimum standards for graduation. Independent school governance seeks to avoid them at all costs in favor of inputs and outputs: accreditation indulges us so we never have to look at what success or failure looks like nor ever be required to measure it. The evidence below is showing a sector catching up with that lack of vision and data. 

Inputs

Inputs are generally tactical. Independent schools have made them appear like strategies by calling them “Best Practices” and creating enormous infrastructure in the form of associations and conferences to support this illusion of them being strategic. To be strategic, they need to be more than just important to the silo that is empowered to execute them, they must represent wide-scale acceptance of their processes and purposes. If you look at Chart 3, what is most astounding is that of these tactical processes that are the source of most independent school inputs, there is not one process considered by 50% or more of the heads surveyed as “very effective”. And yet these are processes that have been in place and refined for decades supported by expensive association “expertise”.

We have written extensively about how “Independent School Strategic Planning is Neither Strategic nor Planning”, but let’s look at some of the other processes generating inputs from above:

  1. The Budget Process. What are the most important inputs into a budget? It’s not the number of teachers. It’s not the salaries of teachers. It’s not the cost of living for teachers. It’s not the size of the annual fund. And yet Boards build budgets top-down (not zero-based)  using metrics like inflation, fundraising, and enrollment to determine a budget because these are things they understand. Consequently, they take last year’s budget and adjust for the above metrics. Tuition increases are the common solution to cover any shortfalls. But nobody asks if the current internal cost structure is sound, a critical question when schools are trying to put the brakes on tuition increases.

    Since the largest cost item in a school budget is the cost of staff (with benefits), how teachers use their time will reveal the best allocation of resources providing the lowest cost configurations.  Not all teacher functions are of equal value. Independent schools are facing up to the reality that their supply base of teachers is under pressure and as we will see in Part 2 on teachers (confirmed by the data), this means looking at the way teacher time is used, afforded, and allocated. Proxies like class size and a quietly expanding list of curriculum choices are history. 

    CFOs at schools historically have had no input on the allocation of teaching resources because it’s not part of their silo, which means that they and their association (NBOA) are impacting less than 40% of the cost of the Program. Again this does not mean just deciding to add or delete courses, it means looking at what the higher value and lower value teacher tasks are, who is doing them, and how much time the better teachers are employed doing higher-value work. It’s generally considered a conversation for academic administrators, but in their silo, there is no incentive to reengineer the allocation of instructional resources because the unit of measurement is the very abstract FTE. Thus, we have a governance conundrum, and this issue becomes the hot potato that nobody wants to address.
  1. The PD and Curriculum Development Process

    Depressing does not even come close to my reaction to the numbers in these rows that don’t even approach 25% as being “very effective” by the Heads surveyed. We could write volumes here but let us summarize the two biggest challenges:

    (a) missions and portraits of a graduate are extrinsic statements that have not been aligned with opportunities for students to be assessed on wider skills or competencies: the proof is seen in the failure of PBL, SEL and Mastery Transcripts to impact schools despite thousands of dollars spent.

    (b) the scope and sequence has too much power to neutralize any innovation by pushing it to the margins in terms of priority or time allocation in the school year: teachers know this and so they pay lip service to the initiative of the year knowing full well “that this too shall pass”.  If you are going to do PD next year, do what schools like Rutgers Prep (NJ) in the OESIS Network have done and consider a whole school pathway, first to build capacity and alignment, not to implement programming.

Outputs

Independent schools are very proud of their outputs. But they don’t believe that they serve any purpose in aligning various constituencies with the school’s mission. However, paying good money to build on these outputs still feels worthwhile with plenty of consultants there to help. The data in the column below needs little explanation other than to say that the accreditation process and marketing initiatives tend to focus on these outputs because they are a basis of comparison with other schools, are low-risk activities, and are easily credentialed by consultants and associations.

Outcomes

By this point I hope you have generated in your mind a few ideas for what might be good outcomes to determine the effectiveness of independent school governance. Let me put it differently: if NAIS was evaluating itself and its governance model, what would it look for in terms of outcomes? For decades the most important outcome that parents have looked for at independent schools across the world has been the health and safety of their children. That makes sense as a customer-centric outcome. As an association for leaders in independent schools, one would think an outcome related to leadership stability would be what NAIS would want. Let’s see if we can find evidence of such outcomes in the data.

In Chart 5, we asked Heads about, not only their outlook for the currently unseen level of Head turnover at independent schools, but also what might help alleviate it. As you can see from the results, not only is this something that 81% of current Heads see as “likely” or “very likely” to persist for years but something without a solution: not one of the possible solutions got to even 20% as a very likely antidote, including better education of aspiring talent, greater Board support, better search firm practices or even greater compensation. 

We offered in Chart 6 below a combination of inputs, outputs, and outcomes for Heads to prioritize as their top 5 concerns. Top of the list was an outcome. 

What is amazing is that in the top 5 are 3 outcomes (mental health, polarization, and leadership capacity) and 2 inputs (enrollment and recruitment). Top of the list by quite a margin is the parent priority outcome on health and safety which must surely be a north star of governance effectiveness measurement. What many schools fail to realize is that mental health, student or leadership capacity, and more can be measured. The research-validated Educational Vital Signs tool, developed by the global non-profit leader on emotional intelligence, Six Seconds, is able to measure this in many different ways by looking at involvement, learning, safety, and thriving: as you can see from the chart below it can be normed to provide benchmarking.

Conclusion

The independent school governance model is hemorrhaging leadership and is presiding over a mental health crisis for students. Furthermore, the governance model is also about to enter a supply crisis in a framework of tactical input processes at the budget level, Planning and PD areas that are considered by most Heads as not very effective. It’s time for a Governance re-write. The 50 Year NAIS Governance Experiment is Over. I rest my case. Part 2 turns our focus to the survey data on teachers and how to address the supply base.

If you are a Head of School and want to continue this discussion please consider applying to join our Head of School Listserve (there is no cost to participate and comments are not to be shared without permission) moderated by Sanje Ratnavale, President of OESIS Network, Inc. 

Sanje Ratnavale

Sanje founded OESIS in 2012 and serves as the President of what has grown to become the leading network for innovation at independent schools: the acronym OESIS grew from the initial focus on Online Education Strategies for Independent Schools. He has held senior administrative positions at independent schools including Associate Head of School at a K-12 school for seven years, High School Principal for three years, and CFO for seven years. Prior to making a switch to education, Sanje spent 15 years in venture capital, investment banking, and senior C-level (CEO, COO, CFO) management. He was educated at Christ Church, Oxford University (B.A. and M.A. in Law/Jurisprudence). Sanje is based out of Santa Monica.

One thought on “OESIS 2022 Head of School Survey Report, Part 1 of 3: Governance | Sanje Ratnavale | 9 Min Read

Leave a Reply

Your email address will not be published. Required fields are marked *